
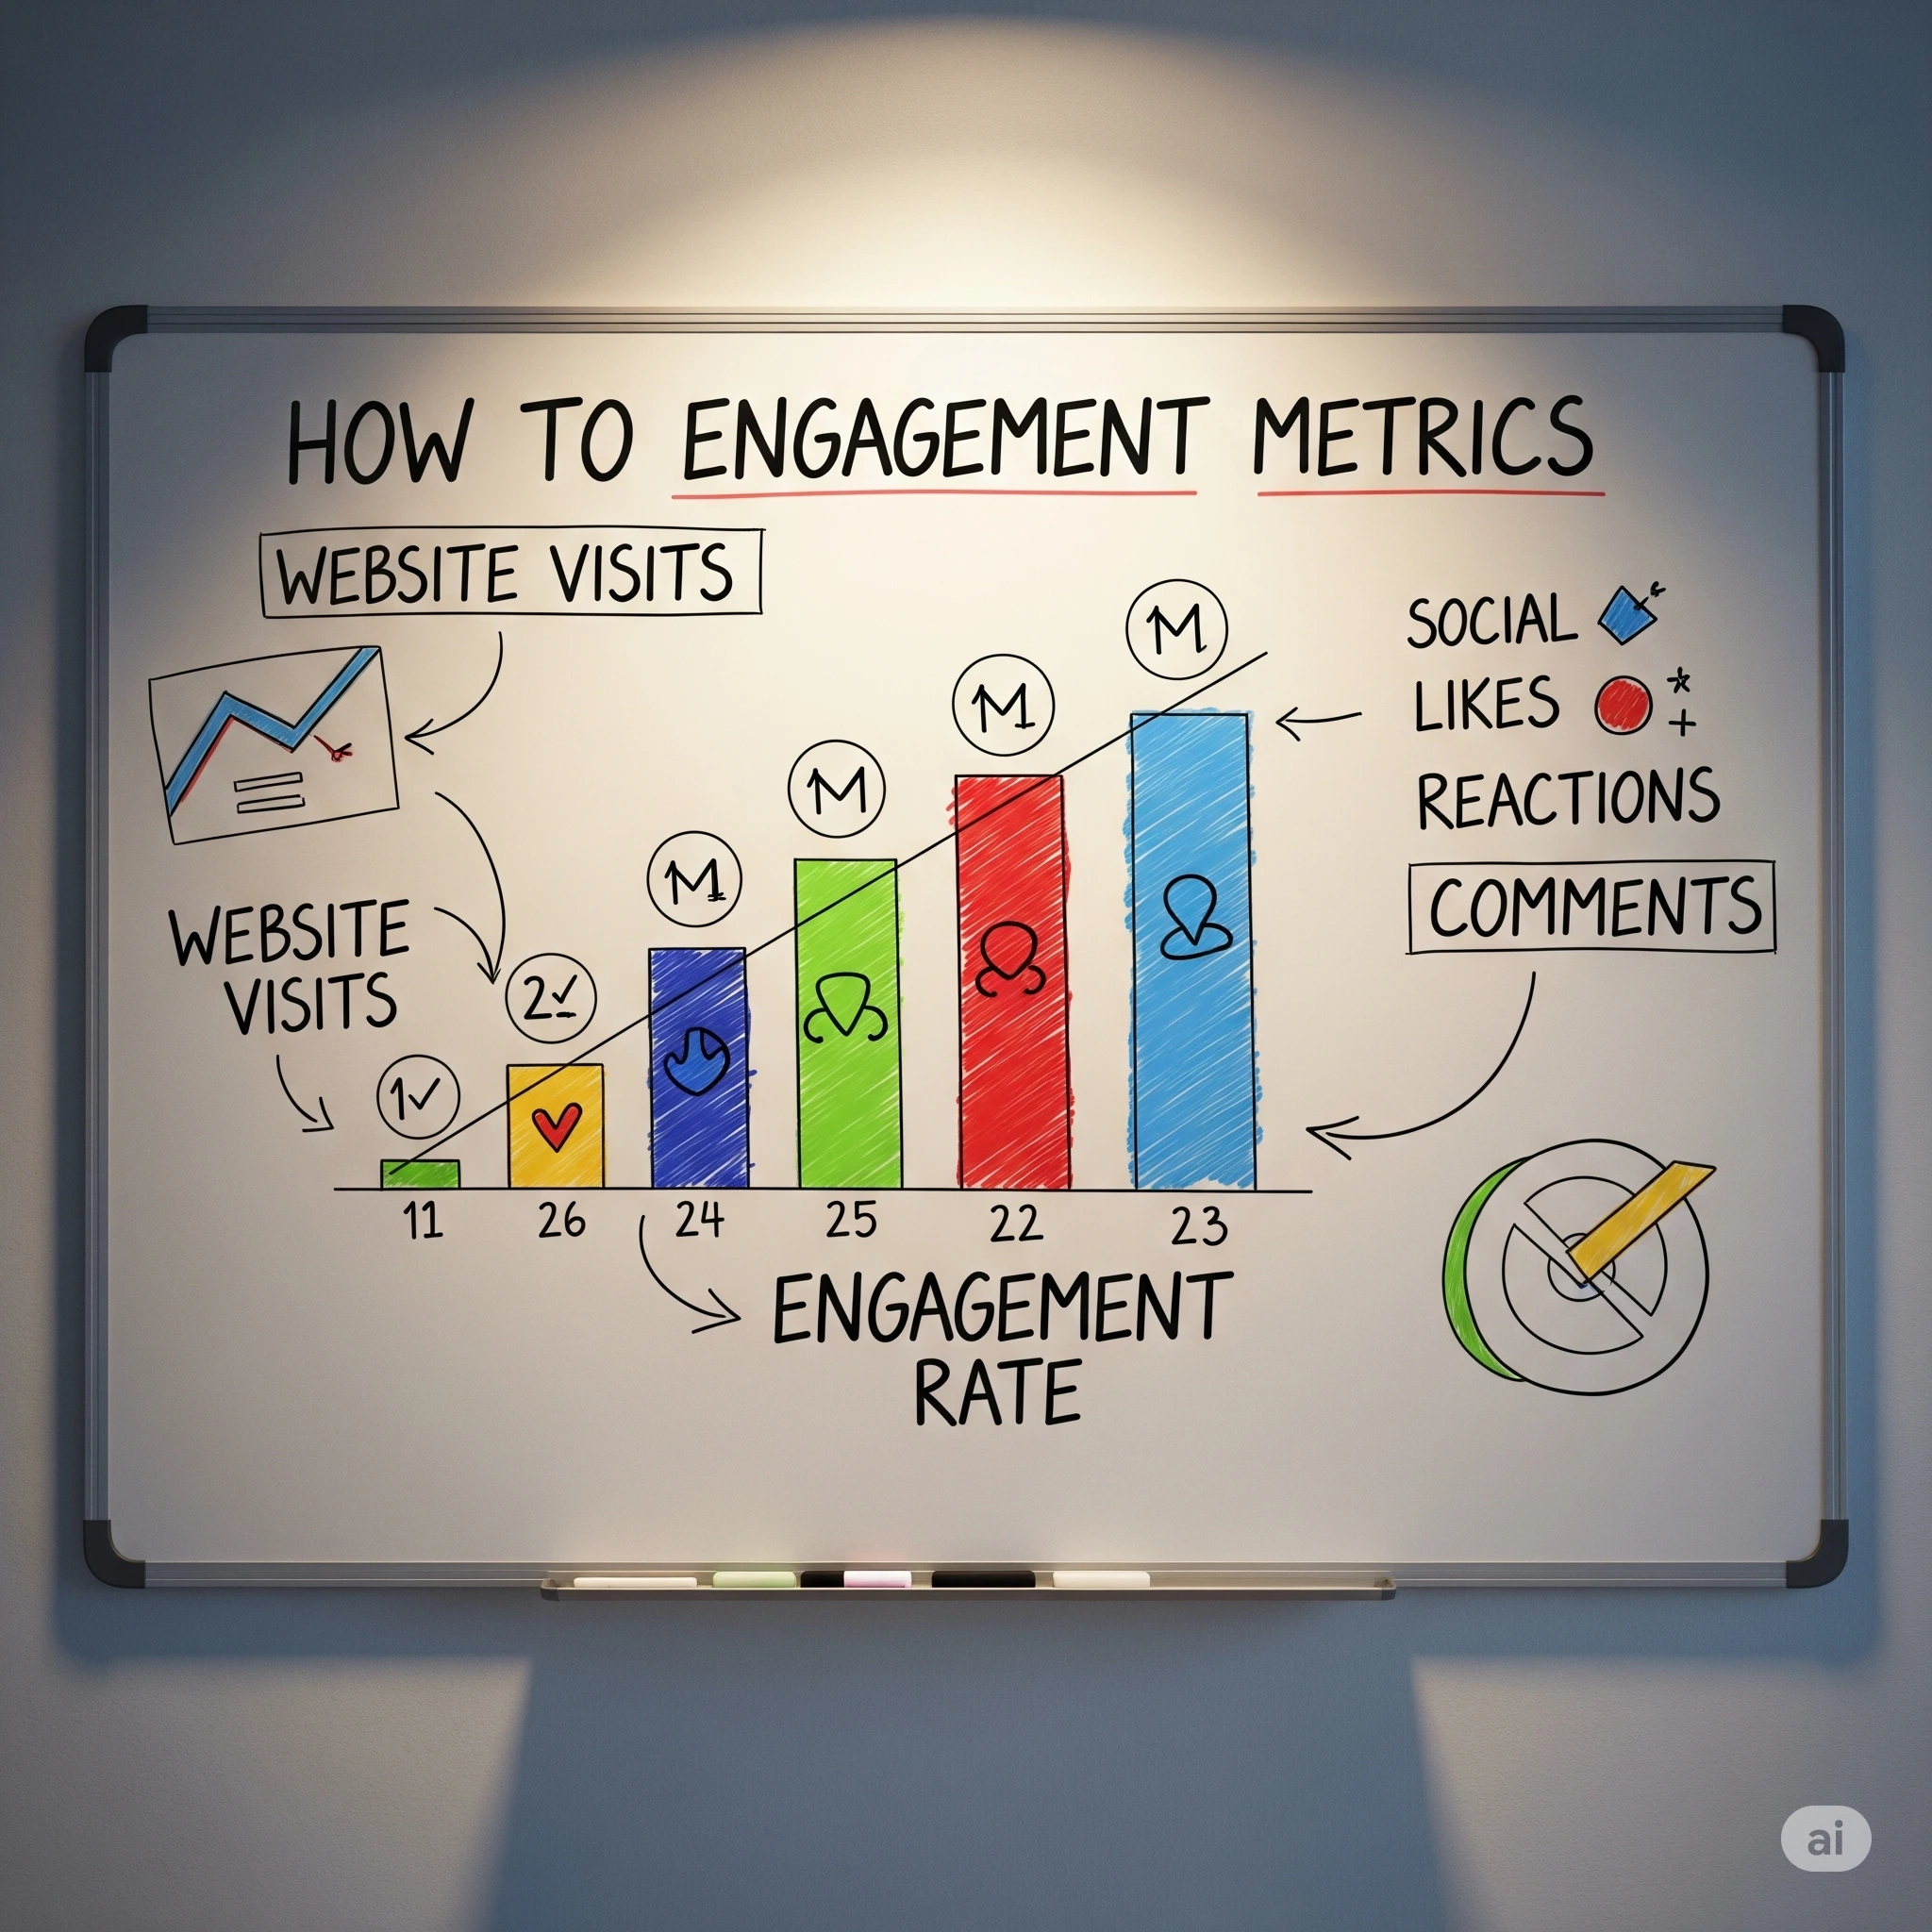
12 Email Engagement Metrics to Track in 2025
In 2025, email infrastructure is no longer just about delivery—it’s about engagement. This blog dives into the 12 most important email engagement metrics every platform should track, from open rates and CTR to unsubscribe rates and inbox placement. You’ll learn how each metric works, why it matters, and how infrastructure teams can use them to improve deliverability, maintain sender reputation, and adapt to ISP expectations in real time.

Five years ago, email infrastructure was focused on one core objective: delivery. If the message landed anywhere in the inbox, mission accomplished. But in 2025, delivery is just the starting point. What truly matters now is what happens after that email arrives. Do recipients open it? Click through? Read it or scroll past? Or do they delete it without a glance?
These aren’t just marketing metrics—they’re engagement signals. And inbox providers like Gmail and Outlook are watching them closely. Engagement now plays a critical role in inbox placement and sender reputation. For email infrastructure teams, this shift means engagement metrics can’t sit on the sidelines anymore—they must be baked directly into the platform’s logic.
What Are Engagement Metrics and How Do They Work in Email Infrastructure?
Engagement metrics track how recipients interact with your emails—things like opens, clicks, read time, and unsubscribes. They reveal how real users respond to your message once it’s delivered. For infrastructure platforms, these metrics are far more than just nice-to-know stats—they’re operational signals that can throttle sends, suppress risky users, detect deliverability issues, and guide IP/domain warmups.
In today’s email ecosystem, engagement metrics are no longer optional—they’re foundational. They tell inbox providers whether you're adding value or creating noise. And if your infrastructure isn’t tracking and acting on them in real time, you're flying blind.
Why Engagement Isn’t Just for Marketers Anymore
Let’s get something straight: engagement metrics aren’t just for the marketing dashboard.
Infrastructure teams now use engagement data to guide sending behavior. Metrics inform when to throttle, when to pause, when to re-route, and when to suppress.
Think of them as early warning systems. If your bounce rate ticks up, if your spam complaints spike, or if open rates dive, those aren’t just signals—they’re smoke. And smoke means fire.
Top Email Engagement Metrics Every Infrastructure Platform Should Monitor in 2025
1. Open Rate
Open rate tracks how many recipients open your email—a basic but foundational metric in email infrastructure. While Apple’s Mail Privacy Protection has introduced some noise, open rate still offers directional insight into subject line performance, sender recognition, and inbox placement.
For infrastructure teams, consistent open rate patterns help detect deliverability issues early. If open rates suddenly drop, it can signal inboxing trouble, spam placement, or domain reputation problems. Paired with other metrics, it’s still a valuable engagement signal.
How It Works in Email:
Open tracking relies on a tiny pixel embedded in the email.
It activates when the email is viewed and the images are loaded.
Apple Mail privacy features can inflate these numbers.
Its Advantages:
- Indicates subject line effectiveness
- Reflects inbox visibility
- Helps detect deliverability issues
2025 Benchmark:
A 26.5% open rate is considered healthy across most industries.
2. Click-Through Rate (CTR)
CTR measures how many people clicked a link within your email. It’s widely regarded as the most honest form of engagement because it reflects intentional interaction—not just curiosity.
For email infrastructure platforms, CTR is essential for scoring user interest, optimizing throttling, and tracking performance across segments. High CTRs validate not only content, but the technical setup behind timely delivery and readability.
How It Works in Email:
Click tracking adds redirect links that log each click before sending users to the destination.
It captures interaction without relying on pixel loading.
Reliable across devices and clients.
Its Advantages:
- Reflects real engagement and intent
- Validates CTA strength
- Guides content optimization
2025 Benchmark:
A 4.1% CTR is the current industry average for high-performing campaigns.
3. Bounce Rate
Bounce rate shows how many emails failed to reach recipients, either permanently (hard bounce) or temporarily (soft bounce). It’s a technical signal with massive deliverability implications.
High bounce rates damage IP reputation and trigger ISP scrutiny. That’s why infrastructure platforms use real-time bounce feedback to automatically suppress bad addresses, maintain sender health, and protect overall list hygiene.
How It Works in Email:
SMTP servers return bounce codes during delivery attempts.
Hard bounces are logged immediately; soft bounces may retry.
Platforms suppress bounces automatically after thresholds.
Its Advantages:
- Maintains a clean and valid email list
- Prevents sender reputation decay
- Helps filter out risky contacts
2025 Benchmark:
Hard bounces should stay below 0.7% to preserve deliverability.
4. Spam Complaint Rate
Spam complaint rate tells you how often recipients manually flag your emails as spam. It's one of the strongest negative engagement signals inbox providers monitor.
Even a complaint rate above 0.1% can start hurting deliverability fast. Infrastructure tools must be designed to react instantly—by suppressing users, adjusting volume, or reevaluating content targeting—before damage compounds.
How It Works in Email:
Mail providers forward complaints via feedback loops (FBLs).
These get logged and tied to your domain or IP.
Infrastructure systems use this for automatic suppression.
Its Advantages:
- Identifies misaligned targeting or poor consent
- Directly affects inbox placement.
- Prevents future blacklisting
2025 Benchmark:
Stay below 0.1% to avoid spam folder placement.
5. Inbox Placement Rate
Inbox placement rate shows how many of your delivered emails actually land in the inbox—not the spam or promotions folder. Unlike raw delivery, it reflects true sender trust.
Email infrastructure platforms use inbox placement to validate domain/IP warmup, reputation standing, and the success of authentication protocols. It’s a crucial metric when evaluating whether your messages are seen—or silently filtered.
How It Works in Email:
Monitored via seed lists and third-party inbox testing tools.
Tracks real inbox outcomes, not just accepted deliveries.
Used to evaluate domain warmups and ISP trust.
Its Advantages:
- Confirms actual visibility, not just delivery
- Guides warm-up and volume scaling
- Validates sender domain health
2025 Benchmark:
88% inbox placement is the industry goal for reputable senders.
6. Read Time / Dwell Time
Read time, or dwell time, measures how long recipients actually spend viewing your email. If users linger, it suggests the content was relevant, readable, or actionable.
For infrastructure providers, it’s a signal of content quality and user intent. It also informs machine-learning models that control engagement-based throttling, improving inbox outcomes.
How It Works in Email:
Calculated using tracking pixels and interaction logs.
Some platforms measure scroll depth or time in focus.
Requires images to load and stay open for several seconds.
Its Advantages:
- Reflects message quality
- Helps optimize layout and length
- Signals meaningful engagement
2025 Benchmark:
Average dwell time is 9.2 seconds for well-performing emails.
7. Forward or Share Rate
This rare but powerful metric tracks how often users forward or share your email content. It indicates deep trust and content relevance.
When recipients organically distribute your message, you extend reach without extra sends. Infrastructure platforms can use this signal to surface high-performing campaigns or prioritize similar send strategies.
How It Works in Email:
Detected via trackable “Forward to a Friend” links or share buttons.
Also measured through list growth from forwarded campaigns.
Some ESPs log native client forwards.
Its Advantages:
- Drives organic distribution
- Indicates content worth sharing
- Reflects deep recipient trust
2025 Benchmark:
0.3% forward/share rate is a strong performance indicator.
8. Device & Client Breakdown
This metric shows what devices (mobile, desktop) and email clients (Gmail, Outlook, Apple Mail) users are engaging with. It impacts design, rendering, and deliverability.
Knowing your audience’s tech stack helps infrastructure teams test for compatibility issues, optimize formatting, and avoid platform-specific rendering bugs that can hurt user experience and engagement.
How It Works in Email:
Collected through email headers, user-agent strings, and client identification.
Logged automatically by ESPs and analytics tools.
Used to flag rendering issues and test responsive design.
Its Advantages:
- Ensures emails look good everywhere
- Prevents layout breaks or font bugs
- Optimizes for the most-used devices
2025 Benchmark:
68% of emails are opened on mobile; 32% on desktop.
9. Geolocation Trends
Geolocation data identifies where and when recipients engage with your email. It’s used to align send times and content to local behaviors.
Infrastructure platforms apply this to throttle sends regionally, personalize content, and improve timing strategies based on real engagement windows—like mid-morning in a recipient’s time zone.
How It Works in Email:
Geolocation is derived from IP addresses upon open or click.
Helps group engagement by country, region, or time zone.
Supports localized campaign delivery.
Its Advantages:
- Improves open rates with smarter timing
- Enables regional personalization
- Supports localization strategies
2025 Benchmark:
Mid-morning local time sees the highest engagement rates globally.
10. Unsubscribe Rate
Unsubscribe rate tracks how many recipients opt out after receiving your emails. While some churn is natural, high unsubscribe rates signal that something’s off.
For infrastructure systems, this metric helps identify fatigue or relevance issues before they turn into spam complaints. Managing unsubscribes proactively preserves reputation and keeps list's health intact.
How It Works in Email:
Logged through unsubscribe link clicks or list management forms.
Handled via suppression rules and list hygiene workflows.
Tracked at the ESP or infrastructure level.
Its Advantages:
- Helps preserve list health and trust
- Identifies audience disengagement
- Reduces the risk of future spam complaints
2025 Benchmark:
A rate around 0.2% is considered acceptable and healthy.
Reduce unsubscribe rates by sending relevant, personalized content and offering clear frequency or preference controls. Monitor engagement signals early and adjust sending strategies to match user interest and behavior.
11. Conversion Rate
Conversion rate measures how many recipients took a desired action—like purchasing, signing up, or booking a demo—after interacting with an email.
It’s a direct reflection of whether your email strategy drives results. Infrastructure platforms tie this to performance reporting, goal tracking, and campaign ROI analysis across domains and sender profiles.
How It Works in Email:
Tracked through tagged links (UTM parameters) and analytics goals.
Requires syncing with web or app conversions.
Attributed back to the original email interaction.
Its Advantages:
- Connects email to business results
- Validates offer, content, and CTA.
- Justifies email marketing investment
2025 Benchmark:
2.9% average conversion rate across B2B and transactional emails.
12. Engagement Over Time
This metric tracks how engagement trends evolve across your audience over weeks or months. Are users staying active—or slipping into inactivity?
For infrastructure teams, monitoring this over time supports smarter suppression, reactivation campaigns, and proactive lifecycle management. It’s essential for keeping lists fresh and avoiding deliverability drag.
How It Works in Email:
Analyzes open, click, and interaction patterns over time.
Triggers based on days of inactivity or response decay.
Often integrated into lifecycle workflows.
Its Advantages:
- Protects sender reputation through early suppression
- Enables lifecycle and win-back emails
- Supports data-driven list pruning
2025 Benchmark:
Expect a 45% drop in engagement after 90 days of inactivity.
The Real Job: Turning Metrics Into Action

It’s not enough to track engagement metrics—you need to act on them. Data only has value when it drives real decisions. If you notice a spike in spam complaints, your system should suppress those recipients immediately. If open and click rates are dropping, it’s a signal to reduce your sending frequency or revisit your targeting. And if inbox placement takes a hit, it’s time to pause your campaigns and troubleshoot before reputational damage spreads. In 2025, the best email infrastructure platforms don’t just display metrics on a dashboard—they use them to shape how, when, and to whom messages are sent. Engagement data should be baked directly into your sending logic, guiding every decision with real-time precision. That’s the difference between reactive sending and truly intelligent infrastructure.
Final Thought
Inbox placement is earned. And in 2025, you earn it by understanding your audience—and how they’re responding. For infrastructure teams, engagement isn’t just a “marketing metric”—it’s your sender reputation in motion. Track the right signals. Build systems that respond in real time. And remember: the inbox isn’t just where your message lands—it’s where trust is built, maintained, or lost.
If you’re serious about improving deliverability and building a more responsive, data-driven infrastructure, now’s the time to act. Start by embedding engagement insights directly into your platform logic, not just your reporting stack. Because in today’s email ecosystem, your next opportunity—or your next blacklist—is only one campaign away.
Book a demo with MailKarma and see how we turn engagement data into email success.
FAQs
Q1: Are open rates still reliable in 2025?
They’re less accurate due to privacy changes, but still useful. Pair them with CTR and read time for a fuller picture.
Q2: What metrics should infrastructure teams track daily?
Inbox placement, bounces, complaints, opens, and clicks. These are your frontline indicators of sender health.
Q3: How is engagement data collected?
Through tracking pixels, link clicks, ESP logs, and FBLs. Most platforms automate this across systems in real time.
Q4: What’s a healthy unsubscribe rate?
0.2% or lower is typically considered safe. Higher rates suggest fatigue, poor targeting, or frequency issues.
Q5: When should we react to rising spam or bounce rates?
Immediately—don’t wait for weekly reviews. Delays can snowball into delivery and reputation problems.
Q6: What’s the biggest mistake teams make with engagement data?
Treating it like a report, not a real-time control tool. It should drive platform behavior, not just fill dashboards.
Q7: How often should we run re-engagement or sunset workflows?
Review segments every 30–45 days for activity. Suppress inactive users after 60–90 days to protect deliverability.
Q8: Which metric best predicts inbox placement?
Spam complaint rate is the biggest red flag. Pair it with CTR and long-term engagement for accuracy.
.png)
Recent Blogs


FAQs: Everything You’re Wondering About Cold Email Deliverability & MailKarma’s Infrastructure
MailKarma is a dedicated email infrastructure solution built exclusively for cold email outreach. Unlike shared inbox tools or general ESPs, MailKarma gives you complete control over your sending setup—private US IPs, clean domains, and expert-backed deliverability practices. Built by cold email pros, MailKarma is optimized to scale outreach without landing in spam.
Because MailKarma sets up private infrastructure—including custom domains and mailboxes—it doesn’t offer a traditional free trial. However, you can explore the platform, view your dashboard, and test features before provisioning infrastructure. Our private dedicated email servers cost $150 per server plus $0.001 per email sent, making it extremely cost-effective for high-volume cold email campaigns. For Gmail Workspace solutions, pricing starts at $3.50 per email with a 10-email minimum, dropping to $2.50 per email for volumes over 100 emails. This transparent pricing model ensures you only pay for what you use while maintaining enterprise-grade email deliverability.
Yes. MailKarma automatically sets up SPF, DKIM, and DMARC records using best-in-class standards. No technical hassle—our system handles everything behind the scenes, and our support team is always ready to assist if needed.
Every MailKarma subscription includes:
- Automated DNS setup (SPF, DKIM, DMARC)
- Private mailbox hosting
- Ongoing deliverability optimization
- Server monitoring and uptime guarantees
It depends on your monthly sending volume and the number of contacts per sequence. To simplify this, MailKarma includes a volume-based calculator inside the app to help you choose the optimal setup for scale, safety, and inbox placement.
Gmail and Outlook aren't built for cold outreach—they throttle volume, rotate IPs, and limit deliverability. MailKarma gives you:
- Dedicated infrastructure
- Warmed IPs and aged domains
- No shared resources
- Built-in best practices for cold outreach
It's the infrastructure your outreach actually needs.